
Predicting the 2020 NBA Playoffs
For our final project, we decided to predict the teams that would have made it do the playoffs in 2020. We used historical data of games statistics since the 1980 playoffs to base our prediction.
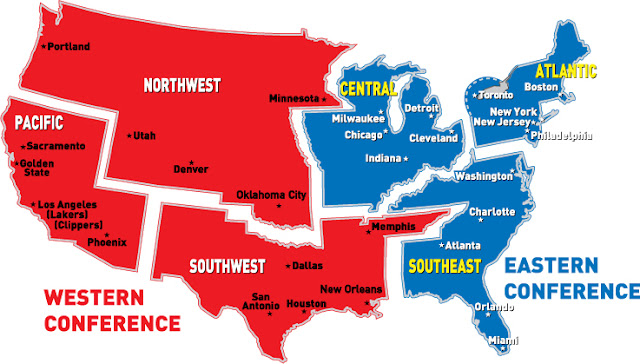
Every regular season, there are 30 teams divided into two conferences: Western and Eastern. Each team plays 82 games per season - 41 home and 41 away. At the end of the regular season, the eight teams with the most wins in each conference qualify for the playoffs.
We decided to compare the results of 3 different models to do our predictions, and see which model would be the most accurate.
Link: Project Repository
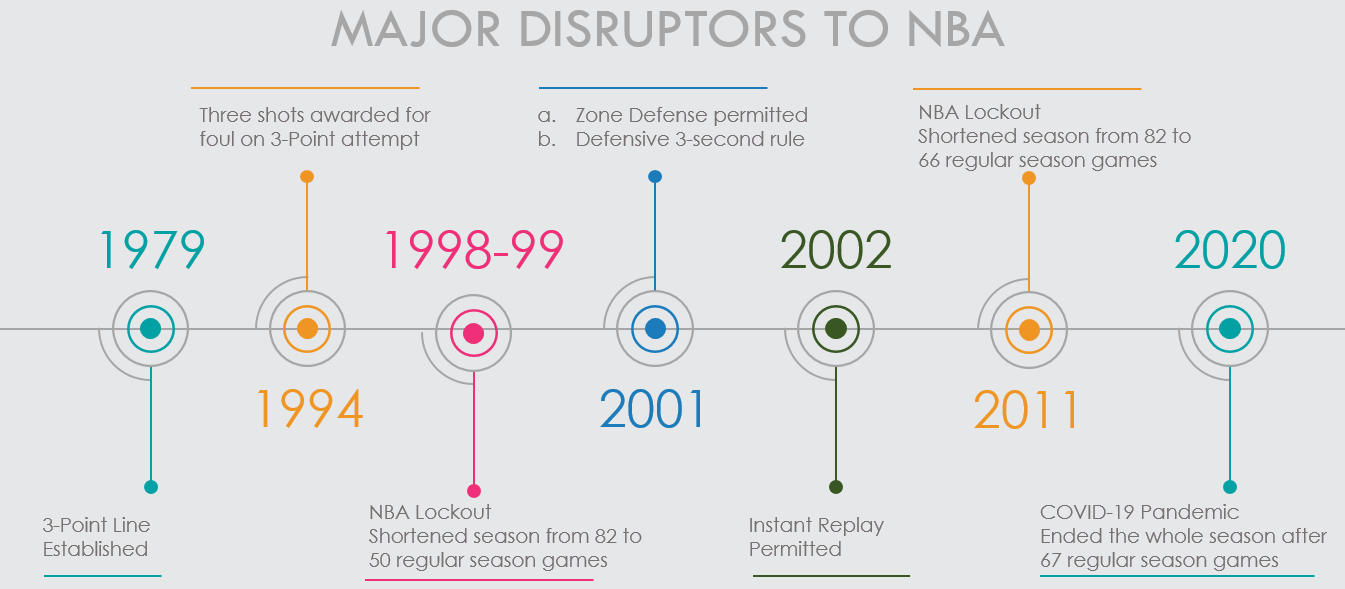
Why we chose 1980 - major change in the gameplay
Starting in the 1979-80 NBA season the 3-point line was implemented with the intention of increasing the chances for shorter players to earn more points and to expand defense away from the basket.
To build our models, we wanted to be able to pull as much data as possible to optimize machine learning. After reviewing various NBA data sites, we chose https://www.basketball-reference.com/.
Reasoning:
To scrape the data we used HTML parsing with Python’s Beautifulsoup to build a JSON table per our specified date-range to go year-by-year (e.g. page-by-page) to scrape and parse the data needed from two separate tables housed on each year’s summary page (example: https://www.basketball-reference.com/leagues/NBA_2020.html):
This data was then written into a CSV file for Machine Learning analysis.
We developed three different types of models, Logistic Regression, Random Forest, and Support Vector Machine (SVM).
Data PreprocessingEach performance statistic of the regular season data was scaled using a quantile transformer by each year (all columns except RK, Team, Year, Games, and Conference) and normalized. This transformed the data so the performance statistic was comparable for each season.
We used two variations of game wins - count of wins and losses versus win rate.
Training and TestingWe split the regular season data by Eastern and Western conferences. From the split data, 1980 to 2018 was used to train the model. We tested the trained models against the 2019 season. Finally, we predicted 2020 playoff teams based on the statistics from the incomplete season.
Link: Preprocessing (WL) , Preprocessing (W%) , Train/Test Models (WL) , Train/Test Models (W%) , Saved Models
Each model was run with all performance statistics, but with varied structure for game wins. Each model was trained twice: first, with the scaled and and normalized data, then with the count of game wins and losses, and once with the % of wins.
We found that using the scaled and normalized count of wins and losses generally improved the model scores.
| Logistic | Random Forest | SVM | ||||
|---|---|---|---|---|---|---|
| WL | W% | WL | W% | WL | W% | |
| Train | 0.927 | 0.910 | 1.000 | 1.000 | 0.933 | 0.927 |
| Test | 0.933 | 0.933 | 1.000 | 1.000 | 0.933 | 0.867 |
| Logistic | Random Forest | SVM | ||||
|---|---|---|---|---|---|---|
| WL | W% | WL | W% | WL | W% | |
| Train | 0.910 | 0.888 | 1.000 | 1.000 | 0.926 | 0.913 |
| Test | 0.933 | 0.867 | 1.000 | 1.000 | 1.000 | 1.000 |
Game outcomes (whether wins, losses, or w%) is the most important feature of all the models.
| Logistic | Random Forest | SVM | ||||
|---|---|---|---|---|---|---|
| Order | WL | W% | WL | W% | WL | W% |
| 1 | L (-) | W% (+) | W | W% | L (-) | W%(+) |
| 2 | W (+) | TOV (-) | L | 2P% | W (+) | STL (+) |
| 3 | STL (+) | STL (+) | 2P% | FG% | STL (+) | DRB (+) |
| 4 | TOV (-) | DRB (+) | FG% | DRB | TOV (-) | TOV (-) |
| 5 | DRB (+) | FG% (+) | DRB | AST | FTA (+) | FTA (+) |
| Logistic | Random Forest | SVM | ||||
|---|---|---|---|---|---|---|
| Order | WL | W% | WL | W% | WL | W% |
| 1 | L (-) | W% (+) | L | W% | L (-) | W% (+) |
| 2 | W (+) | DRB (+) | W | 2P% | W (+) | 2PA (-) |
| 3 | DRB(+) | 2PA (-) | 2P% | FG% | 2PA(-) | DRB (+) |
| 4 | 2PA (-) | TOV (-) | FG% | DRB | DRB (+) | STL (+) |
| 5 | TOV (-) | STL (+) | DRB | 2PA | ORB (+) | ORB (+) |
2P - 2 Pointers
2PA - 2 Pointers Attempted
2P% - 2 Pointers Percentage
3P - 3 Pointers Made
3PA - 3 Pointers Attempted
3P% - 3 Pointers Percentage
AST - Assists
BLK - Blocks
Conf - Conference/Region (East or West)
DRB - Defensive Rebounds
FG - Field Goals Made
FGA - Field Goals Attempted
FG% - Field Goals Percentage
FT - Free Throws
FTA - Free Throws Attempted
FT% - Free Throws Percentage
G - Number of Games
L - Losses
MP - Minutes Played
ORB - Offensive Rebounds
PF - Personal Fouls
PTS - Points
RK - End of Regular Season Ranking
STL - Steals
TOV - Turnovers
W - Wins
W% - Win Percentage
Year - Year of Playoffs
The model predictions for the 2019 season showed that the Eastern Conference models were better at predicting the teams more precisely than the Western Conference models. The teams that made it to the playoffs are listed in rank order under the "2019 Actual" column.
Teams with higher than .5 probability are listed below in descending order. If there were fewer than 8 teams that meet this criteria, the team with the next highest probability was listed until 8 teams were selected.
Red indicates false predictions.
| Logistic | Random Forest | SVM | |||||
|---|---|---|---|---|---|---|---|
| Rank | 2019 Actual | WL | W% | WL | W% | WL | W% |
| 1 | GSW | DEN (.98) | DEN (.95) | DEN (.99) | GSW (.99) | DEN (.99) | DEN (.99) |
| 2 | DEN | GSW (.95) | GSW (.95) | GSW (.98) | UTA (.93) | POR (.99) | POR (.99) |
| 3 | POR | UTA (.95) | UTA (.94) | UTA (.95) | DEN (.90) | UTA (.99) | UTA (.99) |
| 4 | HOU | POR (.95) | POR (.91) | HOU (.94) | OKC (.86) | GSW (.99) | GSW (.99) |
| 5 | UTA | OKC (.81) | OKC (.79) | POR (.89) | POR (.85) | OKC (.93) | OKC (.95) |
| 6 | OKC | LAC (.74) | LAC (.72) | OKC (.89) | HOU (.84) | HOU (.82) | LAC (.80) |
| 7 | SAS | SAS (.71) | SAS (.72) | SAS (.86) | LAC (.80) | LAC (.78) | HOU (.77) |
| 8 | LAC | HOU (.71) | HOU (.66) | LAC (.85) | SAS (.80) | SAS (.69) | SAS (.74) |
| 9 | |||||||
| 10 | |||||||
| Logistic | Random Forest | SVM | |||||
|---|---|---|---|---|---|---|---|
| Rank | 2019 Actual | WL | W% | WL | W% | WL | W% |
| 1 | MIL | TOR (.99) | MIL (.99) | MIL (1.0) | MIL (1.0) | TOR (1.0) | TOR (1.0) |
| 2 | TOR | MIL (.99) | TOR (.99) | TOR (.99) | PHI (.96) | MIL (1.0) | MIL (1.0) |
| 3 | PHI | PHI (.98) | PHI (.97) | PHI (.98) | TOR (.95) | PHI (.99) | PHI (.99) |
| 4 | BOS | BOS (.96) | BOS (.94) | BOS (.96) | BOS (.93) | BOS (.99) | BOS (.99) |
| 5 | IND | IND (.75) | IND (.74) | IND (.93) | IND (.93) | IND (.85) | IND (.84) |
| 6 | BKN | ORL (.68) | ORL (.65) | ORL (.90) | BKN (.84) | BKN (.85) | ORL (.75) |
| 7 | ORL | BKN (.65) | BKN (.60) | BKN (.88) | ORL (.84) | ORL (.80) | BKN (.74) |
| 8 | DET | DET (.80) | DET (.82) | DET (.67) | DET (.50) | ||
DAL - Dallas Mavericks
DEN - Denver Nuggets
GSW - Golden State Warriors
HOU - Houston Rockets
LAC - Los Angeles Clippers
LAL - Los Angeles Lakers
MEM - Memphis Grizzlies
MIN - Minnesota Timberwolves
NOP - New Orleans Pelicans
OKC - Oklahoma City Thunder
PHX - Phoenix Suns
POR - Portland Trail Blazers
SAC - Sacramento Kings
SAS - San Antonio Spurs
UTA - Utah Jazz
ATL - Atlanta Hawks
BKN - Brooklyn Nets
BOS - Boston Celtics
CHA - Charlotte Hornets
CHI - Chicago Bulls
CLE - Cleveland Cavaliers
DET - Detroit Pistons
IND - Indiana Pacers
MIA - Miami Heat
MIL - Milwaukee Bucks
NYK - New York Knicks
ORL - Orlando Magic
PHI - Philadelphia 76ers
TOR - Toronto Raptors
WAS - Washington Wizards
Given that only four teams had clinched a playoff spot before the season was cancelled, there is no ground truth for this set of predictions. However, we thought it would be interesting to see what could have been.
The teams with higher than .5 probability are listed below in descending order.
* indicates teams that have made it to the playoffs.
| Logistic | Random Forest | SVM | |||||
|---|---|---|---|---|---|---|---|
| Rank | 2020 Partial | WL | W% | WL | W% | WL | W% |
| 1 | LAL* | LAL (.98) | LAL (.97) | LAL (.99) | LAL (.97) | LAL (.99) | LAL (.99) |
| 2 | LAC | DEN (.98) | DEN (.95) | DEN (.98) | LAC (.95) | DEN (.99) | DEN (.99) |
| 3 | DEN | LAC (.92) | LAC (.89) | LAC (.97) | DEN (.94) | LAC (.98) | LAC (.98) |
| 4 | UTA | OKC (.87) | SAS (.87) | OKC (.97) | DAL (.92) | OKC (.98) | OKC (.96) |
| 5 | OKC | SAS (.83) | OKC (.83) | UTA (.96) | MEM (.91) | SAS (.87) | SAS (.93) |
| 6 | HOU | DAL (.82) | DAL (.81) | DAL (.90) | UTA (.89) | DAL (.85) | DAL (.84) |
| 7 | DAL | HOU (.71) | HOU (.69) | MEM (.90) | OKC (.89) | MEM (.80) | HOU (.79) |
| 8 | MEM | MEM (.70) | MEM (.67) | HOU (.89) | HOU (.86) | HOU (.79) | MEM (.77) |
| 9 | POR | PHX (.59) | PHX (.62) | ||||
| 10 | NOP | UTA (.50) | |||||
| Logistic | Random Forest | SVM | |||||
|---|---|---|---|---|---|---|---|
| Rank | 2020 Partial | WL | W% | WL | W% | WL | W% |
| 1 | MIL* | MIL (.99) | MIL (.99) | PHI (1.0) | MIL (.98) | TOR (1.0) | TOR (1.0) |
| 2 | BOS* | TOR (.99) | TOR (.99) | TOR (.99) | MIA (.95) | BOS (1.0) | MIL (1.0) |
| 3 | TOR* | BOS (.99) | BOS (.99) | MIL (.98) | TOR (.93) | MIL (1.0) | BOS (1.0) |
| 4 | MIA | PHI (.95) | PHI (.94) | MIA (.98) | PHI (.92) | PHI (.99) | PHI (.99) |
| 5 | IND | MIA (.65) | MIA (.89) | BOS (.97) | BOS (.89) | MIA (.99) | MIA (.98) |
| 6 | PHI | ORL (.64) | ORL (.67) | IND (.94) | IND (.88) | BKN (.84) | BKN (.78) |
| 7 | BKN | BKN (.64) | BKN (.63) | ORL (.92) | ORL (.86) | IND (.74) | IND (.70) |
| 8 | ORL | IND (.64) | IND (.60) | BKN (.86) | BKN (.80) | ORL (.70) | ORL (.68) |
DAL - Dallas Mavericks
DEN - Denver Nuggets
GSW - Golden State Warriors
HOU - Houston Rockets
LAC - Los Angeles Clippers
LAL - Los Angeles Lakers
MEM - Memphis Grizzlies
MIN - Minnesota Timberwolves
NOP - New Orleans Pelicans
OKC - Oklahoma City Thunder
PHX - Phoenix Suns
POR - Portland Trail Blazers
SAC - Sacramento Kings
SAS - San Antonio Spurs
UTA - Utah Jazz
ATL - Atlanta Hawks
BKN - Brooklyn Nets
BOS - Boston Celtics
CHA - Charlotte Hornets
CHI - Chicago Bulls
CLE - Cleveland Cavaliers
DET - Detroit Pistons
IND - Indiana Pacers
MIA - Miami Heat
MIL - Milwaukee Bucks
NYK - New York Knicks
ORL - Orlando Magic
PHI - Philadelphia 76ers
TOR - Toronto Raptors
WAS - Washington Wizards
We averaged all six models to determine which teams we think would have made it into the playoffs for 2020. All four teams that had already clinched playoff spots (marked with an asterisk) were at the top of the lists (though not necessarily in the same order).
| Rank | 2020 Partial | Predicted |
|---|---|---|
| 1 | LAL* | LAL (.98) |
| 2 | LAC | DEN (.97) |
| 3 | DEN | LAC (.95) |
| 4 | UTA | OKC (.92) |
| 5 | OKC | SAS (.88) |
| 6 | HOU | DAL (.86) |
| 7 | DAL | MEM (.79) |
| 8 | MEM | HOU (.79) |
| Rank | 2020 Partial | Predicted |
|---|---|---|
| 1 | MIL* | MIL (.99) |
| 2 | BOS* | TOR (.99) |
| 3 | TOR* | PHI (.99) |
| 4 | MIA | BOS (.95) |
| 5 | IND | IND (.84) |
| 6 | PHI | BKN (.78) |
| 7 | BKN | ORL (.77) |
| 8 | ORL | DET (.62) |
Using Logistic, Random Forest and Support Vector Machine as tools of Machine Learning (ML) we found that all provided similar predictions, whether the importance of the independent values were the same or not. Though, if you look at our section ‘Feature Importance’ you’ll see the strongest values are related to either ‘Win’, ‘Loss’, or ‘W%’ (win percentage); which we believe should be expected in predicting a teams likelihood of earning a place within the Playoffs.
When we removed the WL/W% from the models, we found that defensive stats played a much larger role in the model. Steals (STL), defensive rebounds (DRB), turnovers (TOV) all increase in importance while providing similar predictive results and accuracy.
We ran numerous tests for previous years showing similar results, with a high rate of accuracy (with some inconsistency in 1999 and 2011 during NBA lockouts). With that being said, with the amount of data we currently collect and model, we feel that we have built three models that can predict playoff contention with a ‘strong’ level of accuracy of telling who from each conference will participate in the NBA Playoffs.
Improving the Model
If we had more time with these models, there are several more things we’d like to try.
Continued Testing of Accuracy
We could use these models year-over-year with mid-season statistics to prove accuracy.
Future Models
The natural next step would be to make a model that uses regular season and playoff game data to predict not only who makes it to the playoffs, but who wins the whole thing.